Geophysical modeling

The proposed research will include strong regional interdependencies in the local and regional climate and weather. The weather patterns observed during Maria are consistent with projections from the International Panel of Climate Change (IPCC) scenarios, which point to a much drier and warmer Caribbean, and intensified tropical storms. These are the natural conditions that led to Hurricane Maria in September 2017.
To reproduce Hurricane Maria, we will use the Weather Research and Forecasting (WRF/ARW) mesoscale model. The mesoscale modeling system to be used is able to simulate regional climate forcing at multiple scales of resolutions (100s of meters to hundreds of kilometers) in a dynamical mode. The model uses a terrain-following hydrostatic-pressure vertical coordinate to better represent topography and microphysics- key elements in the sub-grid scale phenomena. Three domains of spatial resolution of 25, 5, and 1 km were used to configure the WRF with 50 vertical levels. The coarser domain contains countries of Mesoamerica and the Caribbean region (MAC) and Pacific Ocean,

5-km domain surface wind speed (m/s) simulated using WRF model during Hurricane Maria (September 20-September 21, 2017). The animation shows the storm track originating south east of the island and leaving at north west. For the 5-km domain maximum wind speed of 135 miles per hour was simulated by the model.
Hurricane Maria WRF simulation (Pokhrel et al., 2021) has a resolution of 1km x 1km, time series data is available with a temporal resolution of 1 hour. The list below shows some of the available relevant variable in the output dataset, in the format “Variable Description (Variable Name)”:
X Wind Component (U)
Y Wind Component (V)
X Wind Component at 10 Meters Height (U10)
Y Wind Component at 10 Meters Height (V10)
Accumulated Total Precipitation (RAINNC)
Temperature at 2 Meters Height (T2)
Sea Surface Temperature (SST)
Latitude (XLAT)
Longitude (XLONG)
Wind Speed During Hurricane Maria
1-km domain maximum for surface wind speed (MPH) simulated using Weather Research Forecast (WRF v 3.8.1) Model during Hurricane Maria passage over Puerto Rico (September 20-September 21, 2017). The simulation shows maximum wind speed of almost 145-150 MPH at some location in the Island. Download wind speed data here.

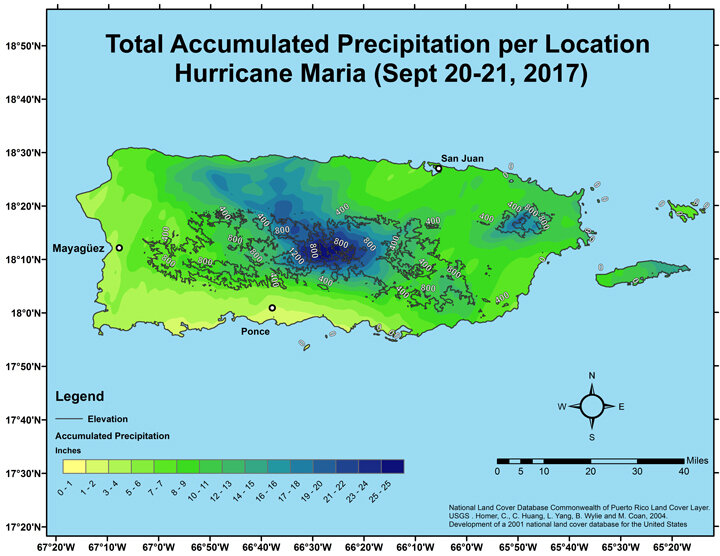
Precipitation During Hurricane Maria
1-km domain cumulative rainfall (Inches) simulated using Weather Research Forecast (WRF v 3.8.1) Model during Hurricane Maria passage over Puerto Rico (September 20-September 21, 2017). The simulation shows a cumulative rainfall of almost 24 - 25 inches at the center of the Island. The precipitation was validated with observations available with a resulting RMSE of 7 inches. Download precipitation data here.